
Continuous Process Monitoring in Real Time
Live dashboards, SLA alerts, and AI-powered anomaly detection for running business processes
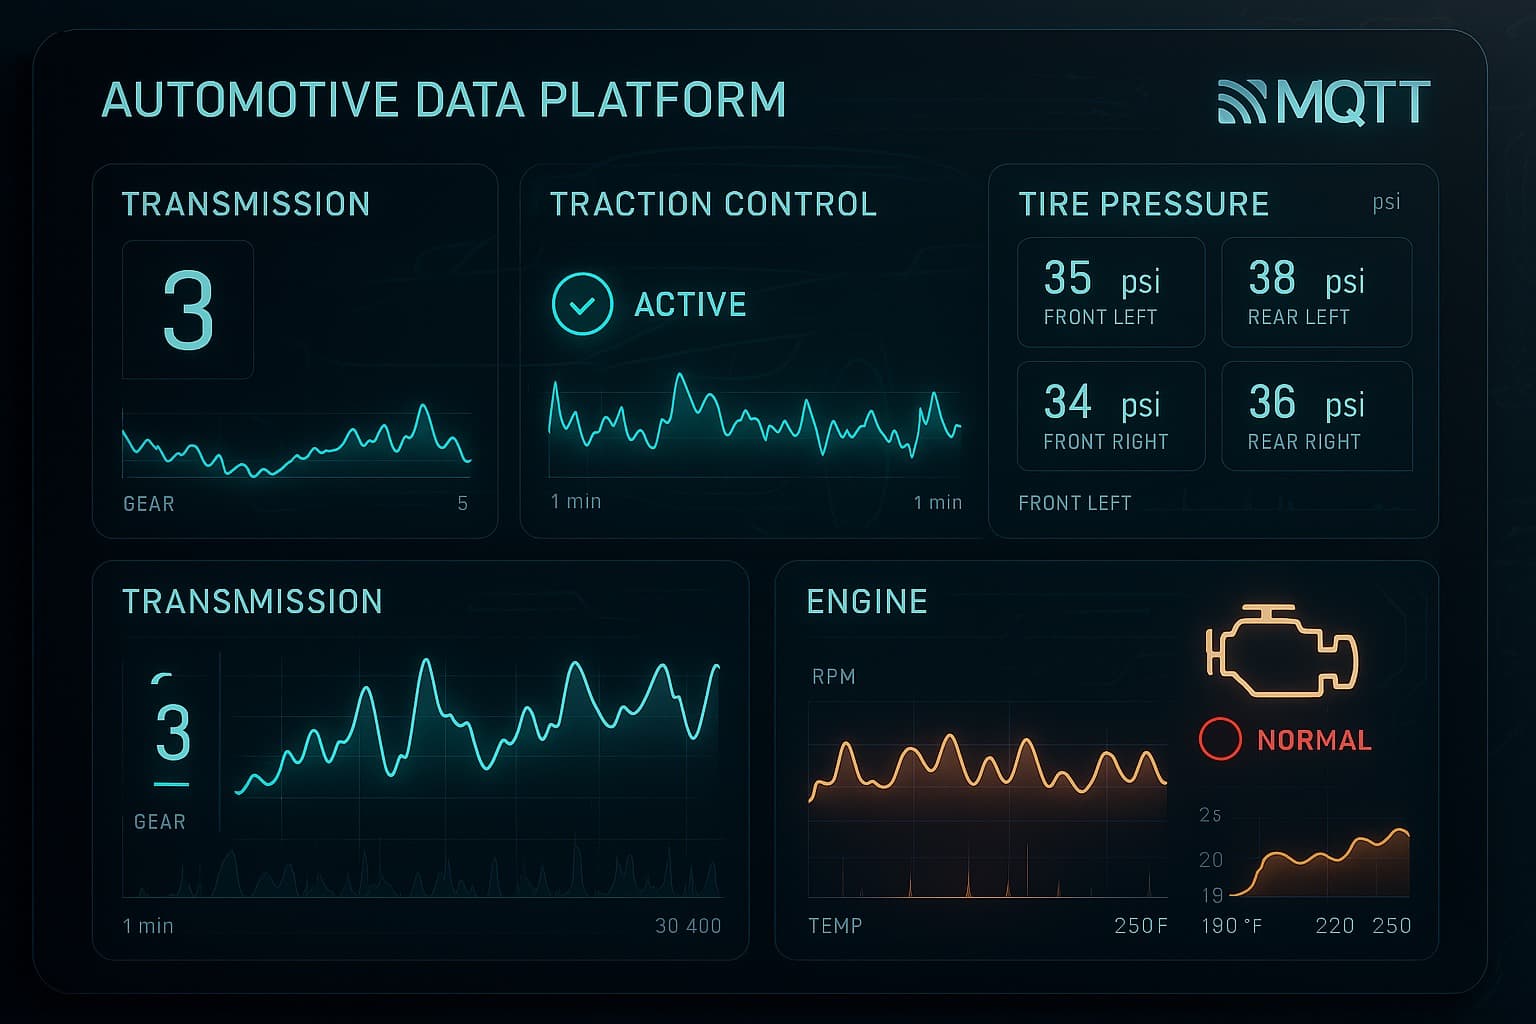
Process optimization shows results once it has been carried out. Process monitoring ensures those results last. The difference is decisive: while a one-time analysis identifies and fixes weaknesses, continuous monitoring immediately detects when an optimized process starts to drift, new bottlenecks emerge, or SLA deadlines are at risk.
Elasticbrains develops tailored process monitoring solutions that track running business processes in real time. We combine process mining on live data, time-series analysis, and custom AI models into early warning systems that detect deviations before they turn into problems. The result: operations teams act proactively instead of reactively.
Monitoring versus Optimization: What Is the Difference?
Many organizations confuse process optimization and process monitoring, or only implement one of them. Both serve distinct purposes and complement each other.
A one-time or periodic analysis, redesign, and improvement of a process. Result: an optimized target state.
Go to Process OptimizationContinuous live tracking of whether the optimized process still runs as intended. Result: sustained effectiveness and immediate responsiveness.
What Continuous Process Monitoring Delivers
Immediate Visibility
Deviations from the target process become visible within seconds, not at the next quarterly review. Operations teams act on facts, not gut feeling.
Sustained SLA Compliance
Automatic SLA alerts escalate before a deadline is breached. This applies to ticket processing, delivery times, claims settlement, or any other process-bound agreement.
Early Anomaly Detection
AI models learn normal process behavior and raise alerts when patterns deviate in ways still invisible to humans. Early warning rather than fire alarm.
Process Mining on Real Data
Instead of relying on assumptions, process mining analyses are based on actual event logs from ERP, CRM, and production systems. This reveals how processes actually run.
Core Features of Our Monitoring Platforms
Live Dashboards per Process KPI
Each process gets a dedicated dashboard with the KPIs relevant to it: cycle time, wait times, error rate, utilization. Configurable by role: COO, operations manager, team lead.
SLA Alerts and Escalation Rules
Thresholds are defined per process and SLA class. If a transaction does not meet the configured processing time, it is automatically escalated via email, Teams message, or ticket.
Process Mining on Live Data
Based on event logs from production systems, process mining algorithms reconstruct the actual process flow. Deviations from the target process are made visible as a conformance score.
Bottleneck Detection
Bottlenecks appear in monitoring as congestion points: positions where transactions wait while other steps run quickly. Automatic heatmaps show where the process is stalling.
AI-powered Anomaly Detection
Machine learning models learn the normal time windows, volumes, and sequences of a process. When a running transaction deviates statistically, an alert is generated, configurable by sensitivity.
Time-Series Historization
All process data is stored with precise timestamps in time-series databases. This enables trend visualization over months and identification of seasonal patterns.
Real-world Use Cases
Order Throughput in Production
A manufacturing company monitors every production order from receipt to delivery. SLA alerts trigger when an order occupies a station too long. Bottleneck detection shows which machines are chronically overloaded.
Claims Settlement in Insurance
Insurance companies must process claims within regulatory deadlines. Process monitoring tracks every claim in real time and escalates before a deadline is breached.
IT Incident Lifecycle
IT organizations monitor support tickets from receipt to resolution. SLA monitoring differentiates by priority class; anomaly detection identifies unusual ticket volumes as an early sign of systemic issues.
Ticket Processing SLAs
Service centers with defined response times use process monitoring for seamless SLA compliance. Dashboards show in real time how many tickets of which priority are still within deadline.
Supply Chain Monitoring
Logistics processes are monitored from order entry to customer delivery. Deviations in delivery times, document approvals, or customs processes are immediately visible.
Quality Processes in Production
Quality inspections are captured as process steps. If the error rate rises at a station, monitoring immediately triggers an alert before a larger batch is affected.
Technology Stack
We select the tech stack based on your requirements: data volume, latency needs, existing system landscape, and security requirements.
Process mining on event logs from ERP, CRM, and production systems. Reconstruction of the actual process flow and conformance checking against the target process.
Specialized databases for timestamp-precise process data with fast aggregation queries. TimescaleDB on a PostgreSQL base for easy integration into existing infrastructure.
High-throughput streaming for production environments with thousands of simultaneous events. Kafka as a backbone for loose coupling between source systems and the monitoring platform.
Custom ML models trained on historical process data. Isolation Forest, LSTM autoencoder, and statistical methods depending on the characteristics of each process.
Grafana for rapid rollout of operational dashboards. Custom dashboards in Vue.js with D3.js for process-specific visualizations and role-based views.
Data is collected at the source: directly from ERP systems (SAP, Microsoft Dynamics), from MQTT-based IoT networks, or via event hooks from cloud platforms.
Our Approach
- Process and Data Assessment: We identify which processes to monitor, which KPIs and SLAs are relevant, and where event data originates. This forms the basis of the monitoring concept.
- Build the Data Pipeline: Connecting source systems, building the streaming infrastructure, and setting up the time-series database. Data flows before dashboards are configured.
- Baseline and Model Training: A behavioral baseline is derived from historical process data. ML models for anomaly detection are trained and validated on this data.
- Dashboard and Alert Configuration: KPI dashboards are configured by role and process. SLA thresholds and escalation rules are defined together with operations and business stakeholders.
- Production and Iteration: Monitoring goes live. In the first weeks, thresholds and alert sensitivity are tuned until the system fires only relevant alarms.
Process monitoring shows where optimization is needed. Process optimization carries out the improvement.
Go to Process OptimizationFor strategic analyses and company-wide dashboards beyond operational monitoring.
Go to Business IntelligenceFrequently Asked Questions
What is the difference between process monitoring and process optimization?
Process optimization is a targeted, often one-time measure: a process is analyzed, redesigned, and improved. Process monitoring is permanently active: it continuously tracks whether the optimized process runs as intended, immediately detects new deviations, and provides the data basis for further optimization rounds. Both complement each other but solve different problems.
Which data sources can be connected?
Almost any structured source: ERP systems (SAP, Microsoft Dynamics), CRM platforms, ticketing systems (Jira, ServiceNow), MQTT-based IoT networks, production databases, cloud APIs, or database change streams. Integration is handled via REST, webhooks, Kafka connectors, or native database integrations.
How does AI-powered anomaly detection work?
First, the normal behavior of a process is learned from historical event data: typical cycle times, sequences, volumes, and time windows. ML models such as Isolation Forest or LSTM autoencoders then detect running transactions that deviate statistically significantly from normal behavior. Sensitivity is configurable so that only relevant alerts are triggered.
How long does implementation take?
A first operational dashboard with basic SLA alerts is often live in two to four weeks once the data pipeline is in place. Full process mining with trained anomaly detection and role-based dashboards typically requires six to ten weeks, depending on the complexity of the processes and the number of source systems.
Is process monitoring worthwhile for smaller companies?
Yes, as soon as processes are SLA-critical or errors in the workflow directly cause costs. Mid-sized companies also have processes where manual oversight is no longer sufficient: order processing, complaint handling, onboarding workflows. A scaled solution without enterprise overhead is feasible in these cases.
Ready for Your Project?
Let us clarify in a non-binding initial conversation how we can best support you.
Free · No obligation · Personal initial consultation by experienced Munich experts